機械学習を用いてデータ分析してみたいです。
このような要望にお応えします。
今回は、カテゴリデータの分析を通じて機械学習を使用していきたいと思います。
分析対象のデータは、UCI machine learning data setの「 Car Evaluation Data Set 」を使用します。( https://archive.ics.uci.edu/ml/datasets/Car+Evaluation )
データの確認と準備
まず、データを読み込んで確認します。
|
1 2 3 4 5 6 7 8 9 10 11 12 13 14 |
import numpy as np import pandas as pd import matplotlib.pyplot as plt %matplotlib inline df = pd.read_csv('car.data', header=None) # 各要素にラベル付け(今回のデータはファイルにラベルがないため、この操作をしておく) col_names = ['buying', 'maint', 'doors', 'persons', 'lug_boot', 'safety', 'class'] df.columns = col_names df.head() |
下記のようにデータは格納されます。
|
1 2 3 4 5 6 |
buying maint doors persons lug_boot safety class 0 vhigh vhigh 2 2 small low unacc 1 vhigh vhigh 2 2 small med unacc 2 vhigh vhigh 2 2 small high unacc 3 vhigh vhigh 2 2 med low unacc 4 vhigh vhigh 2 2 med med unacc |
データを構成する各要素ごとの情報を確認します。
|
1 2 3 4 5 6 7 |
# データを構成する各要素ごとの情報を表示 # データの情報を表示 df.info() # データの分布を確認 for col in col_names: print(df[col].value_counts()) |
|
1 2 3 4 5 6 7 8 9 10 11 12 13 14 15 16 17 18 19 20 21 22 23 24 25 26 27 28 29 30 31 32 33 34 35 36 37 38 39 40 41 42 43 44 |
<class 'pandas.core.frame.DataFrame'> RangeIndex: 1728 entries, 0 to 1727 Data columns (total 7 columns): buying 1728 non-null object maint 1728 non-null object doors 1728 non-null object persons 1728 non-null object lug_boot 1728 non-null object safety 1728 non-null object class 1728 non-null object dtypes: object(7) memory usage: 94.6+ KB med 432 vhigh 432 high 432 low 432 Name: buying, dtype: int64 med 432 vhigh 432 high 432 low 432 Name: maint, dtype: int64 5more 432 2 432 4 432 3 432 Name: doors, dtype: int64 more 576 2 576 4 576 Name: persons, dtype: int64 big 576 med 576 small 576 Name: lug_boot, dtype: int64 med 576 high 576 low 576 Name: safety, dtype: int64 unacc 1210 acc 384 good 69 vgood 65 Name: class, dtype: int64 |
推定したいクラスの内訳を確認します。
|
1 2 |
# 推定したいクラスの内訳確認 df['class'].value_counts() |
|
1 2 3 4 5 |
unacc 1210 acc 384 good 69 vgood 65 Name: class, dtype: int64 |
データの欠損の有無を確認します。データの欠損は、0のようです。
|
1 2 |
# データ欠損の有無を確認 df.isnull().sum() |
|
1 2 3 4 5 6 7 8 |
buying 0 maint 0 doors 0 persons 0 lug_boot 0 safety 0 class 0 dtype: int64 |
学習用データ、検証用データを準備します。
|
1 2 3 4 5 6 7 |
x_data = df.drop(['class'], axis=1) label_data = df['class'] label_cnt = len(df['class'].unique()) from sklearn.model_selection import train_test_split x_train, x_test, y_train, y_test = train_test_split(x_data, label_data, test_size=0.2, random_state=20) |
機械学習手法が適用できるようにデータの特徴量を作りこみます。カテゴリ変数を数値に変換します。
現状のデータは、下記のように特徴量が文字列となっていますので、こちらを数値に変換します。
|
1 2 3 4 5 6 |
buying maint doors persons lug_boot safety 438 high vhigh 2 2 big low 36 vhigh vhigh 3 4 small low 1170 med med 5more 4 small low 1488 low high 5more 2 med low 1474 low high 4 4 big med |
カテゴリ変数の数値への変換は、Pythonライブラリcategory_encodersを使用します。ライブラリがない場合は、pip等を使用してインストールします。その後、下記のように変換します。
|
1 2 3 4 5 6 7 8 9 |
import category_encoders as ce encoder = ce.OrdinalEncoder(cols=['buying', 'maint', 'doors', 'persons', 'lug_boot', 'safety']) x_train = encoder.fit_transform(x_train) x_test = encoder.fit_transform(x_test) # カテゴリ変数の文字列を数値に変換されていることを確認 print(x_train.head()) |
変換の結果、以下のように数値に変換されたデータを得ることができます。
|
1 2 3 4 5 6 |
buying maint doors persons lug_boot safety 438 1 1 1 1 1 1 36 2 1 2 2 2 1 1170 3 2 3 2 2 1 1488 4 3 3 1 3 1 1474 4 3 4 2 1 2 |
機械学習モデルの定義と学習と評価
決定木の適用
カテゴリ変数を含むデータに対して、決定木を適用してみます。
まず決定木のモデル定義、学習、評価は以下のように実施しました。
|
1 2 3 4 5 6 7 8 9 10 11 12 13 14 15 16 17 |
# 機械学習の適用 # 決定木ライブラリ読み込み from sklearn.tree import DecisionTreeClassifier from sklearn.metrics import accuracy_score # 決定木モデル定義 model = DecisionTreeClassifier('gini', max_depth=3, random_state=0) # 決定木学習 model.fit(x_train, y_train) # 決定木評価 y_pred_train = model.predict(x_train) print('train data accuracy score:{}'.format(accuracy_score(y_train, y_pred_train))) y_pred = model.predict(x_test) print('test data accuracy score:{}'.format(accuracy_score(y_test, y_pred))) |
|
1 2 |
train data accuracy score:0.79 test data accuracy score:0.78 |
学習データでのモデルの正解率とテストデータでのモデルの正解率を確認すると、過学習はしてなさそうです。
混同行列を用いて分類性能を確認してみます。
混同行列は、分類アルゴリズムの性能を確認することができます。そして、各カテゴリごとに分類された正しい予測と正しくない予測を見ることができます。
|
1 2 3 4 5 6 7 |
# 混同行列 from sklearn.metrics import confusion_matrix print(confusion_matrix(y_test, y_pred)) from sklearn.metrics import classification_report print(classification_report(y_test, y_pred)) |
|
1 2 3 4 5 6 7 8 9 10 11 |
[[ 45 0 40 0] [ 15 0 0 0] [ 6 0 226 0] [ 14 0 0 0]] precision recall f1-score support acc 0.56 0.53 0.55 85 good 0.00 0.00 0.00 15 unacc 0.85 0.97 0.91 232 vgood 0.00 0.00 0.00 14 |
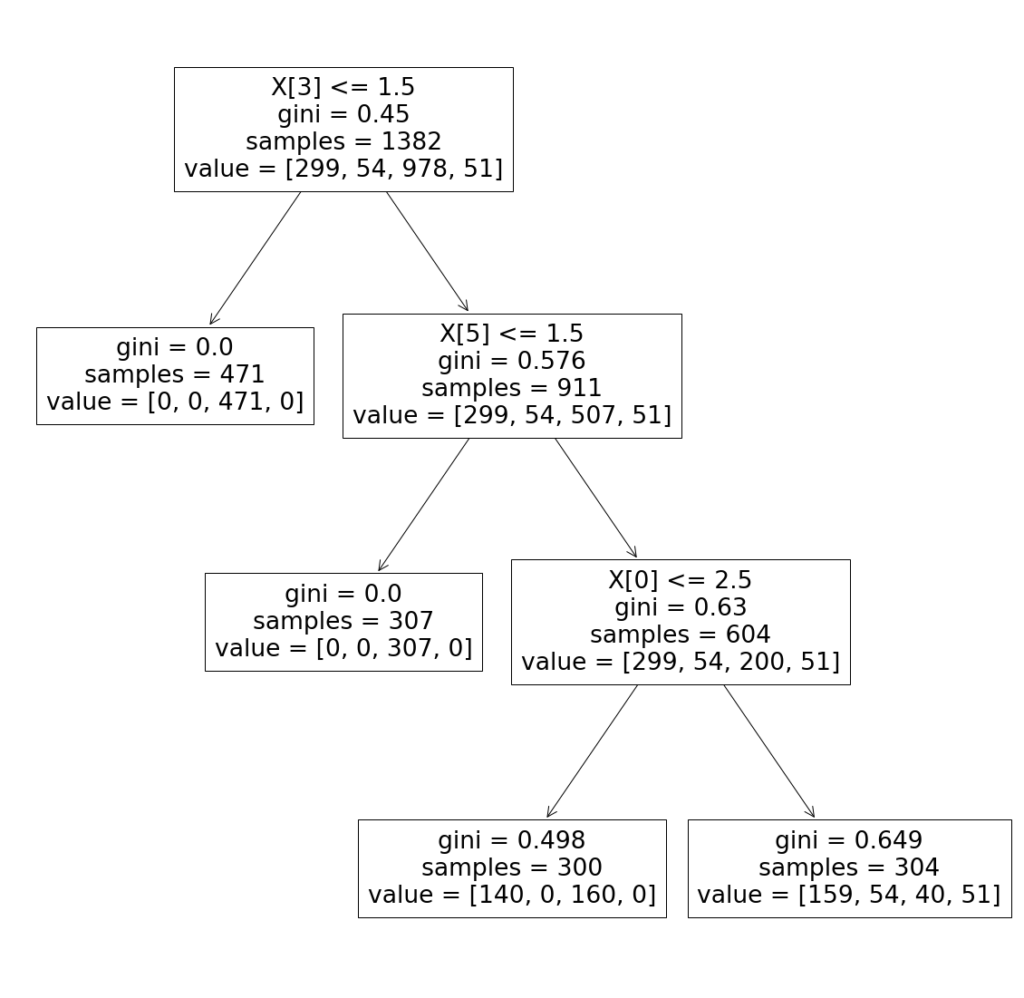
学習した決定木モデルを可視化することも可能です。
|
1 2 3 4 5 6 |
# 決定木モデルの可視化 plt.figure(figsize=(20, 20)) from sklearn import tree tree.plot_tree(model.fit(x_train, y_train)) |

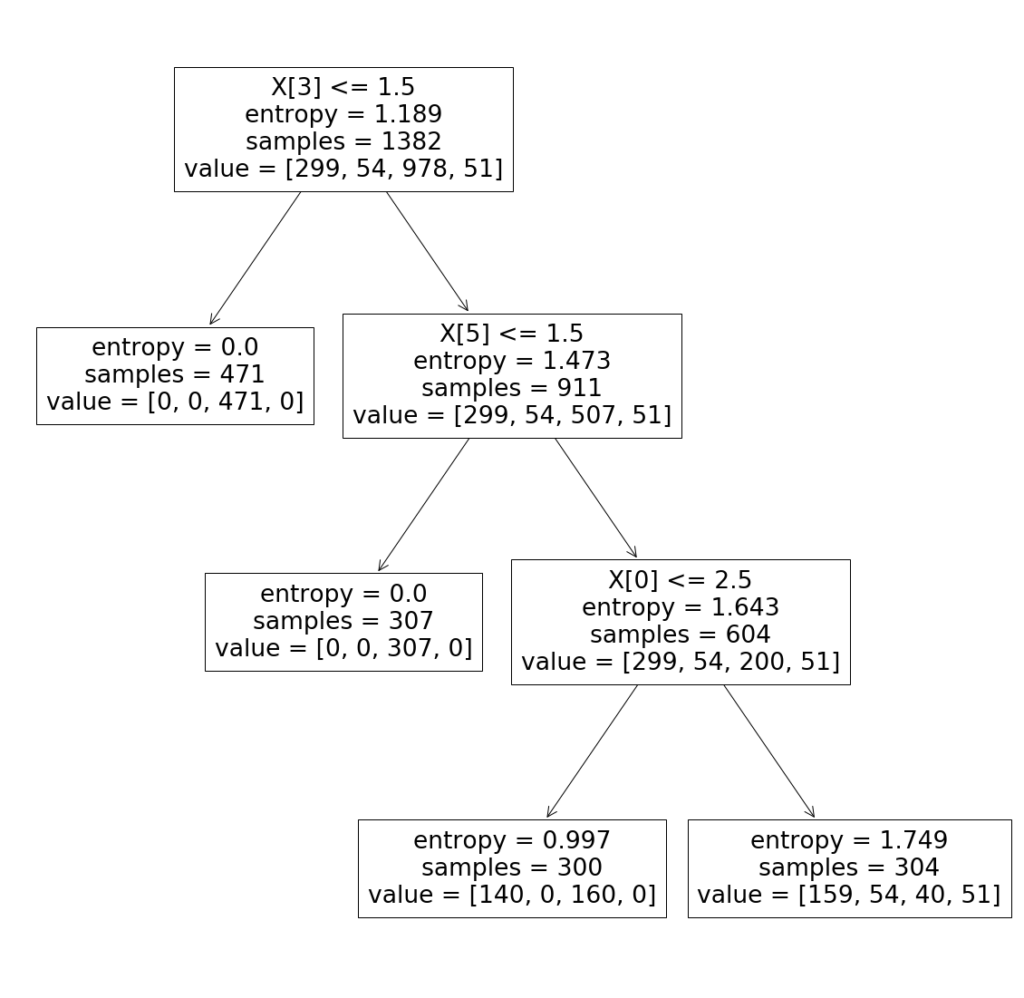
先程はgini係数に基づいて、決定木を適用しました。次は、entropyに基づいて決定木モデルの定義、学習、評価をしてみます。
|
1 2 3 4 5 6 7 8 9 10 11 12 13 14 15 16 17 18 19 20 21 22 23 24 25 26 27 28 29 30 31 |
from sklearn.tree import DecisionTreeClassifier from sklearn.metrics import accuracy_score # 決定木モデル定義 model = DecisionTreeClassifier('entropy', max_depth=3, random_state=0) # 決定木学習 model.fit(x_train, y_train) # 決定木評価 y_pred_train = model.predict(x_train) print('train data accuracy score:{}'.format(accuracy_score(y_train, y_pred_train))) y_pred = model.predict(x_test) print('test data accuracy score:{}'.format(accuracy_score(y_test, y_pred))) # 混同行列 from sklearn.metrics import confusion_matrix print(confusion_matrix(y_test, y_pred)) from sklearn.metrics import classification_report print(classification_report(y_test, y_pred)) # 決定木モデルの可視化 plt.figure(figsize=(20, 20)) from sklearn import tree tree.plot_tree(model.fit(x_train, y_train)) |
entropyに基づいて決定木モデルの評価結果は以下になります。
|
1 2 3 4 5 6 7 8 9 10 11 12 13 14 15 16 |
train data accuracy score:0.7937771345875543 test data accuracy score:0.7832369942196532 [[ 45 0 40 0] [ 15 0 0 0] [ 6 0 226 0] [ 14 0 0 0]] precision recall f1-score support acc 0.56 0.53 0.55 85 good 0.00 0.00 0.00 15 unacc 0.85 0.97 0.91 232 vgood 0.00 0.00 0.00 14 accuracy 0.78 346 macro avg 0.35 0.38 0.36 346 weighted avg 0.71 0.78 0.74 346 |

ランダムフォレストの適用
ランダムフォレストのモデル定義、学習、評価は以下のように実施しました。
|
1 2 3 4 5 6 7 8 9 10 11 12 |
# ランダムフォレストによる分類と特徴量の重要度を計測 from sklearn.ensemble import RandomForestClassifier model = RandomForestClassifier(n_estimators=100, random_state=0) model.fit(x_train, y_train) y_pred = model.predict(x_test) print("Random Forest Training Accuracy:", model.score(x_train, y_train)) print("Random Forest Testing Accuracy:", model.score(x_test, y_test)) print(confusion_matrix(y_test, y_pred)) print(classification_report(y_test, y_pred)) |
ランダムフォレストのモデル評価は以下になります。
|
1 2 3 4 5 6 7 8 9 10 11 12 13 14 15 16 |
Random Forest Training Accuracy: 1.0 Random Forest Testing Accuracy: 0.9566473988439307 [[ 80 1 4 0] [ 3 12 0 0] [ 3 1 228 0] [ 2 1 0 11]] precision recall f1-score support acc 0.91 0.94 0.92 85 good 0.80 0.80 0.80 15 unacc 0.98 0.98 0.98 232 vgood 1.00 0.79 0.88 14 accuracy 0.96 346 macro avg 0.92 0.88 0.90 346 weighted avg 0.96 0.96 0.96 346 |
sklearnのランダムフォレストでは、各特徴量の評価ができますので、分類への影響が低い特徴量を削ることを考慮することも可能です。
|
1 2 3 |
# 特徴量の評価 feature_score = pd.Series(model.feature_importances_, index=x_train.columns).sort_values(ascending=False) print("feature_score\n", feature_score) |
|
1 2 3 4 5 6 7 8 |
feature_score safety 0.290596 persons 0.243427 maint 0.165132 buying 0.137347 lug_boot 0.095687 doors 0.067812 dtype: float64 |
分類への影響が低い特徴量を削除して、再度モデルを学習してみるのもいいかもしれません。
|
1 2 |
x_data = df.drop(['class', 'doors'], axis=1) label_data = df['class'] |
KNN(k-Neighbors Classifier)の適用
KNNのモデル定義、学習、評価は以下のように実施しました。
|
1 2 3 4 5 6 7 8 9 10 11 12 13 14 |
# KNNの適用 from sklearn.neighbors import KNeighborsClassifier model = KNeighborsClassifier() model.fit(x_train, y_train) KNeighborsClassifier(algorithm='auto', leaf_size=30, metric='minkowski', metric_params=None, n_jobs=1, n_neighbors=5, p=2, weights='uniform') y_pred = model.predict(x_test) print("KNN Training Accuracy:", model.score(x_train, y_train)) print("KNN Testing Accuracy:", model.score(x_test, y_test)) print(confusion_matrix(y_test, y_pred)) print(classification_report(y_test, y_pred)) |
KNNのモデル評価は以下になります。
|
1 2 3 4 5 6 7 8 9 10 11 12 13 14 15 16 |
KNN Training Accuracy: 0.9319826338639653 KNN Testing Accuracy: 0.869942196531792 [[ 65 4 14 2] [ 10 5 0 0] [ 4 2 226 0] [ 5 3 1 5]] precision recall f1-score support acc 0.77 0.76 0.77 85 good 0.36 0.33 0.34 15 unacc 0.94 0.97 0.96 232 vgood 0.71 0.36 0.48 14 accuracy 0.87 346 macro avg 0.70 0.61 0.64 346 weighted avg 0.86 0.87 0.86 346 |
まとめ
カテゴリデータの分析を通じて機械学習を適用してみました。Pythonライブラリsklearnでは今回紹介した機械学習手法も比較的簡単に使用することができますので活用してみてはいかがでしょうか。


